FCW

Leveraging user research to optimize lead generation

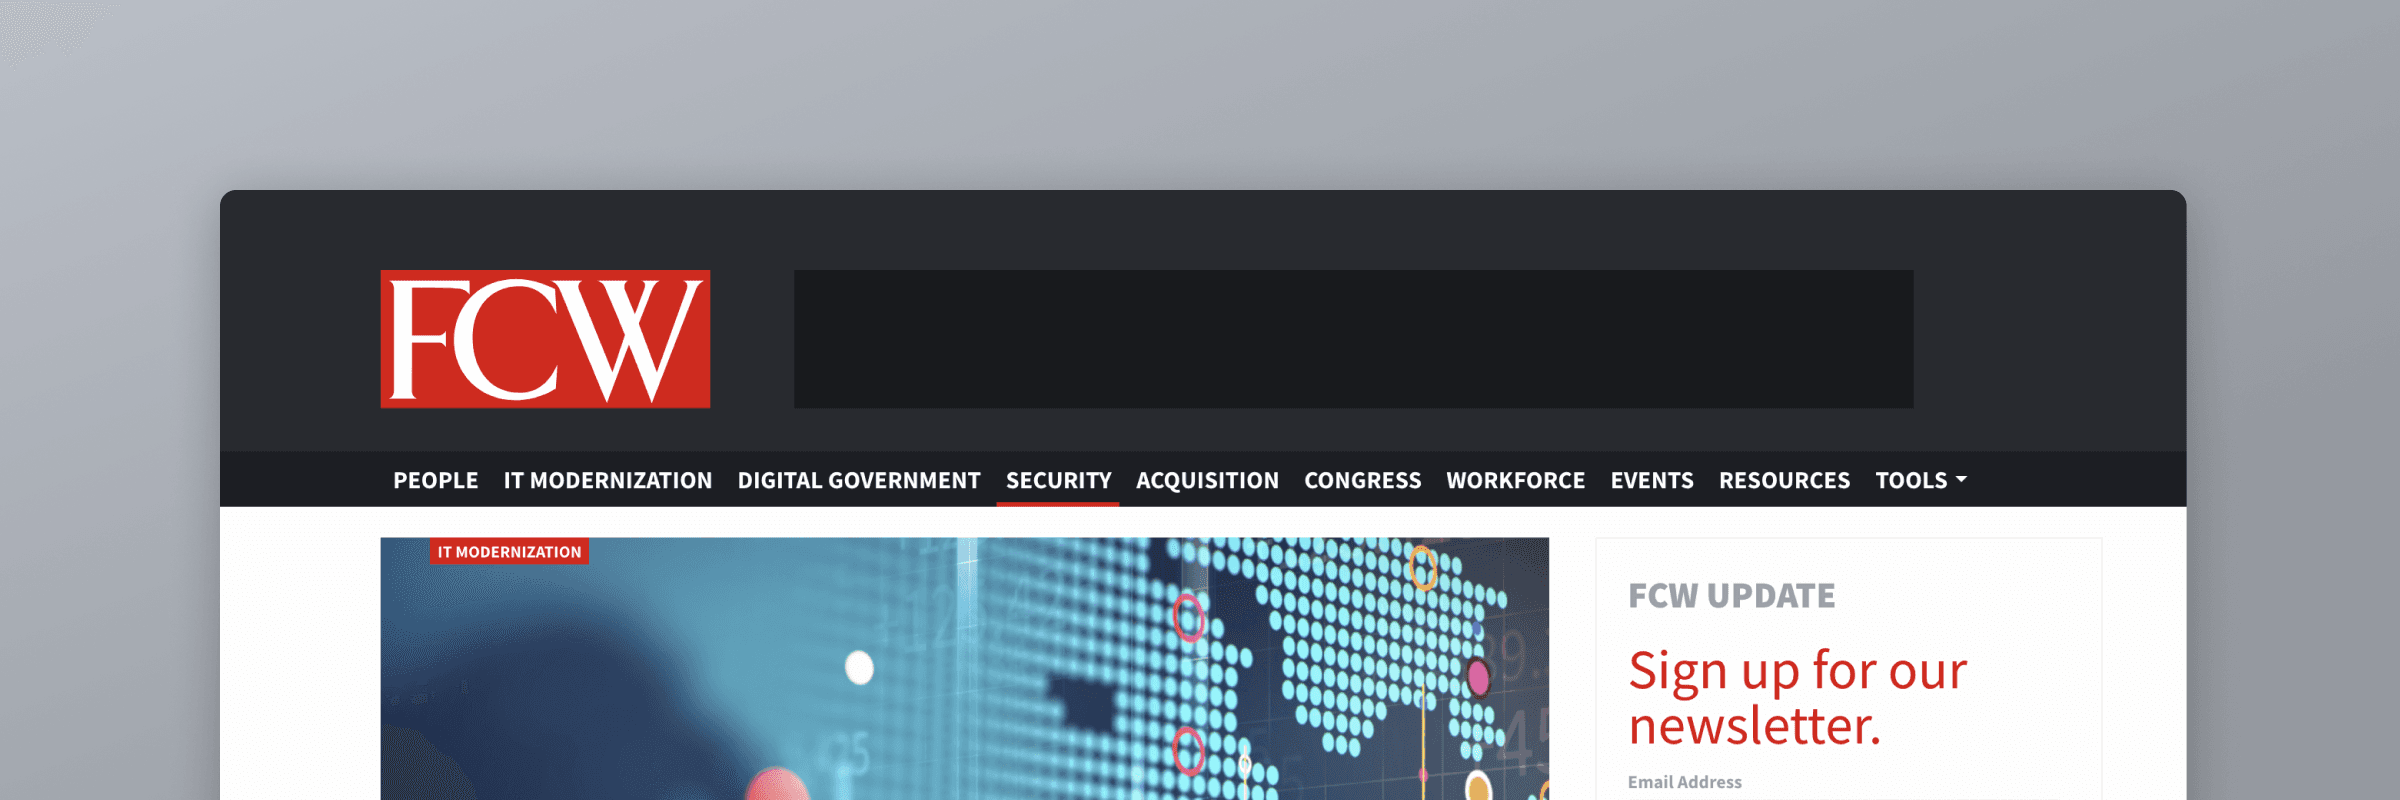
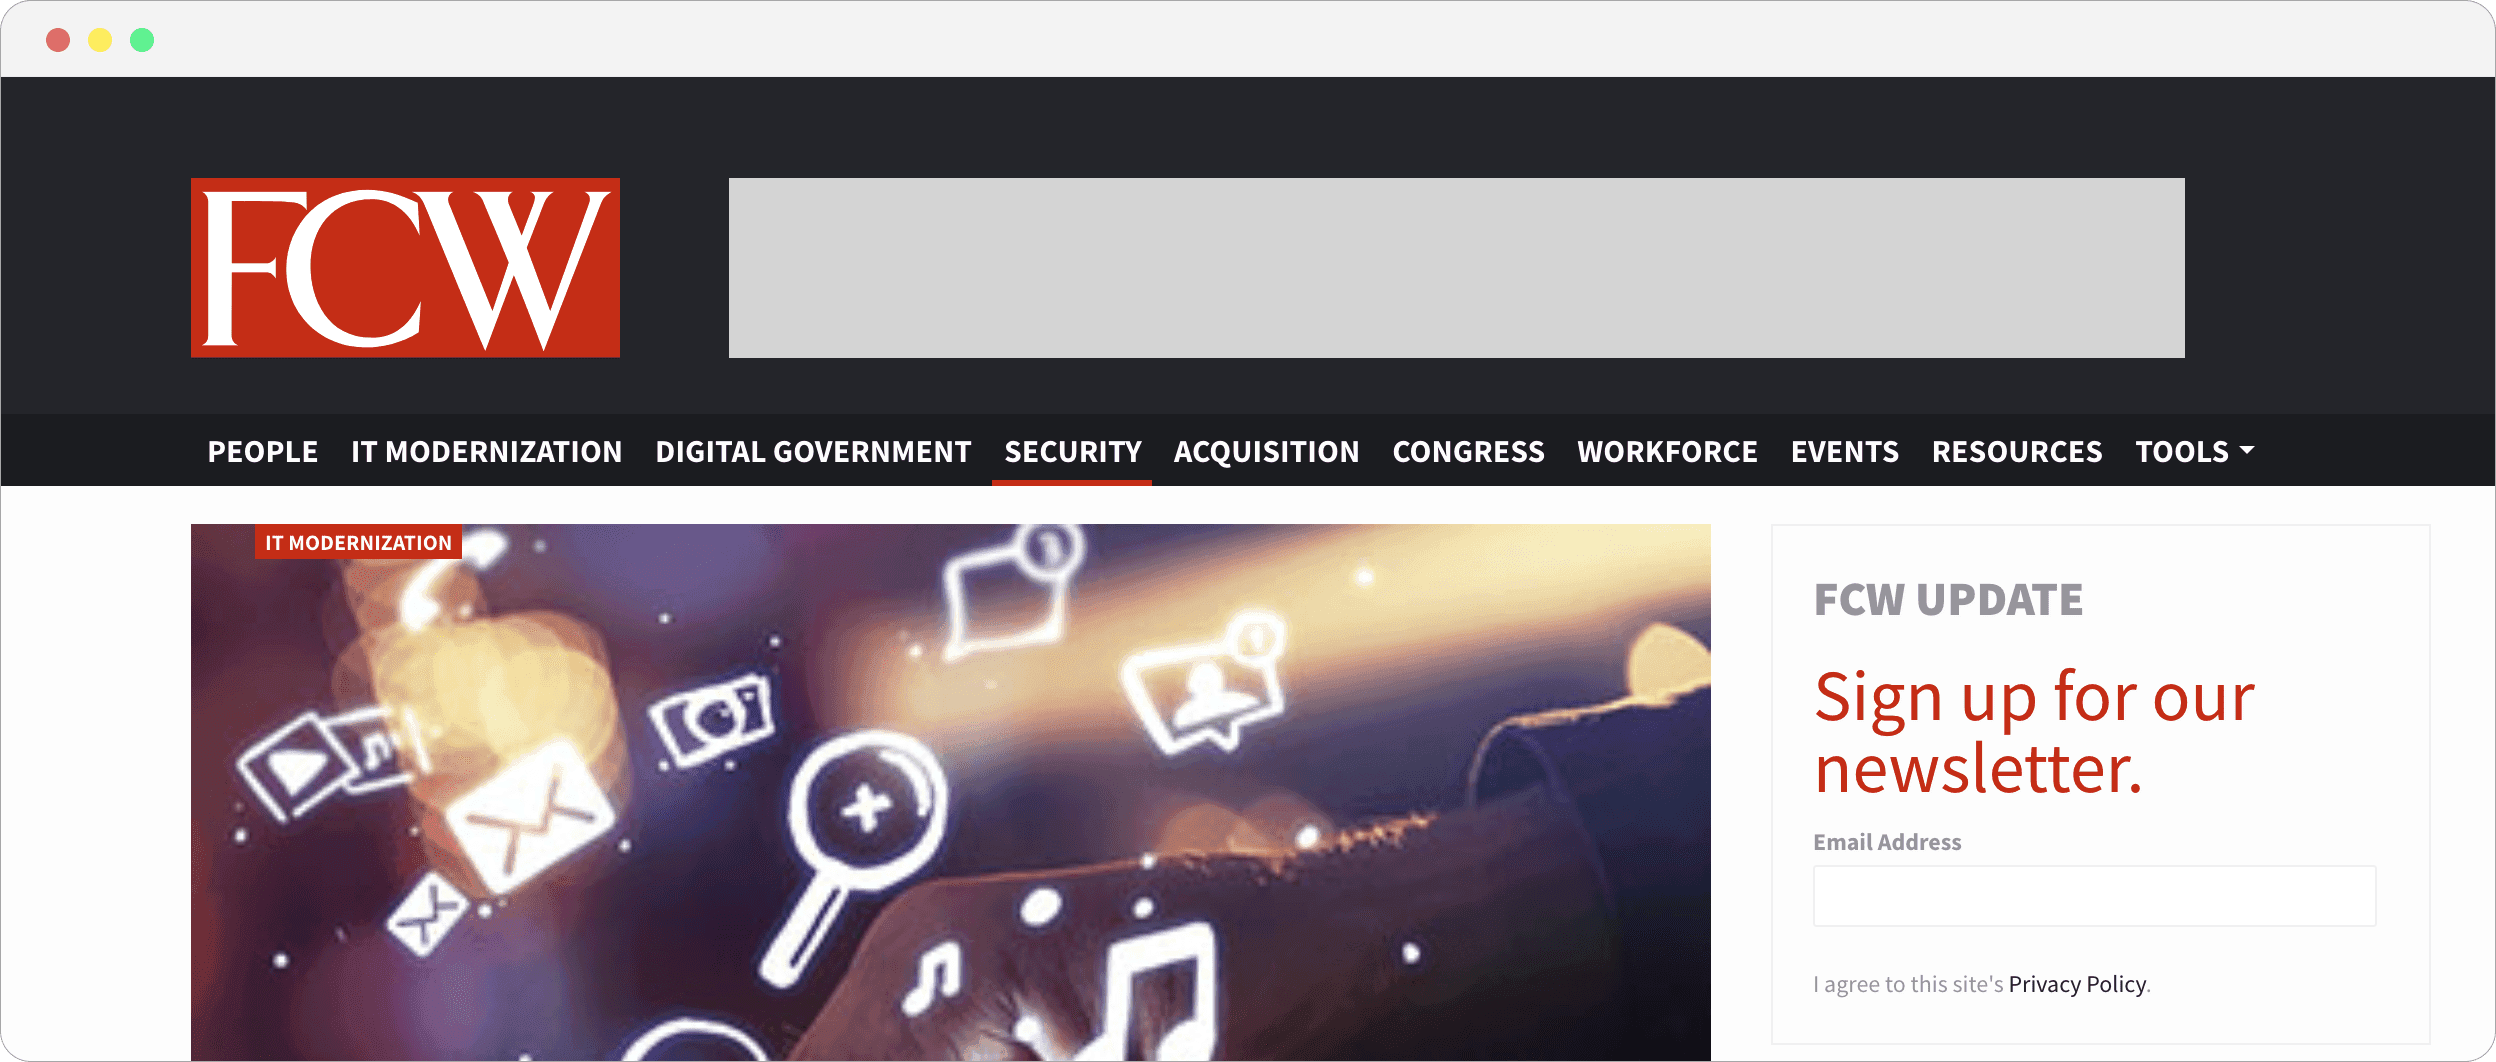
A look at how I approached rebuilding and redesigning the header for our feature website as part of a full site makeover.

Project ACTIVITY
2021
Project Roles
UX/UI, Branding, User Research, Usability Testing, Management, Information Architecture

Background

As the senior web designer at a legacy news media company, I spearheaded an initiative to analyze our analytics in response to a significant increase in user traffic to our flagship product.

Product Screenshots

The header design pre-redesign. At this point, the header was being used in a loudest voice wins. Linked items within the header were just reflections of the on going topics that our sales team was offering.

Product Screenshots

The header design pre-redesign. At this point, the header was being used in a loudest voice wins. Linked items within the header were just reflections of the on going topics that our sales team was offering.

Problem Statement

How are users driving the increased traffic to our website, and what paths are they taking once they arrive?

How are users driving the increased traffic to our website, and what paths are they taking once they arrive?

Strategy

I researched and reviewed web site analytic services and recommended utilizing additional analytics software capable of expanding our analytics insight, specifically leveraging heat mapping.

Heat mapping would capture click frequency after the users landed on our site. We knew most of our traffic was coming in through our newsletter but wanted to know where they were going after first engagement.

Heatmap examples

Execution

After analyzing our site and heat map tests we identified two core improvements: focus our efforts on the newsletter since it was driving over 85% of our traffic, and redesign our header and main navigation to emphasize our newsletter call to action while also reducing the total number of actionable links.

Product Screenshots

Final menu layouts and rebuilt header

Product Screenshots

Final menu layouts and rebuilt header

Challenges

Our existing web site analytics needed more sophisticated tracking features to have a better understanding of the traffic patterns the sites were experiencing. Identifying the source of our traffic spike was the largest and most important challenge at this stage of the project.

Results & Metrics

Results
& Metrics

By reducing the total number of links within the site header we were able to better customize and control editorial themes which converted into larger client contracts and by including a new call to action within the main menu, creating a new user capture funnel for newsletter subscriptions, new user signups increase roughly 20% month over month.

Thanks for checking out my site.

Thanks for checking out my site.

Thanks for checking out my site.

An Em Kay P Website. 2025

An Em Kay P Website. 2025

An Em Kay P Website. 2025